
Kalman Filter
Recently I've been working on a project that involves a Blacktrax motion capture system. We tagged users with two beacons per foot and tracked those in a specific setup. Even though motion capture systems are very accurate and have great detection, in our setup we had to be prepared that sometimes a beacon wasn't detected, for example because of occlusion. When a beacon isn't detected this means that we don't get any positional data. So sometimes we didn't know what the exact position of a foot is. Although the data is pretty accurate we wanted to smooth out values a bit. In this project we wanted to have a position which was stable and didn't changed to quickly because we were drawing visualisations based on the position of the user.
While looking into solution on how to deal with motion capture data; e.g. how to deal with missing frames, how to smooth the received data, etc... I found this great article that describes a couple of great solutions foor smoothing and gap filling.
One of the suggested solutions is to use the Kalman Filter to smooth out noisy data. After reading some articles it was pretty obvious that this is a perfect solution to use. Prior to this project I hadn't used a Kalman Filter before and to be honest most of the descriptions I found were probably very accurate in terms of the original paper; though they didn't really describe how these parameters actually influenced the values I passed into the filter.
Important to mention is that I'm applying the Kalman Filter to 1D data so the kalman filter can be simplified a lot.
I won't get into the details of all the parameters because there are better descriptions than that I could possibly give you. One great introduction into the Kalman Filter is given by Greg. Also this page gives a good introduction on the used symbols. Note that the symbols are named differently sometimes. What I'm trying to do in this article is to share some insights on the parameters that you provide to the Kalman filter, especially when dealing with 1D data.
On this wikipedia page on the Kalman Filter you can see the equations that make up this filter. I'll describe my understanding of the symbols below (note: I'm not expert on this field, and if you see a mistake please let me know at info@[thisdomain.com]).
Assume that for the rest of the article I'm applying the Kalman Filter on a array of values which represent the Y position (Y = goes up) of a foot. Before I'm showing the implementation (in C++) I'm using I'll describe a couple of parameters that you need to understand to influence the output of the filter.
R, The Covariance Matrix of the Measurements (constant)
In probability theory and statistics, covariance is a measure of how much two random variables change together (source Wikipedia). The R matrix holds the covariances of the sensors your use. You retrieve the R matrix from the data sheet of your sensors. Note that these are the covariances of the measurement error.
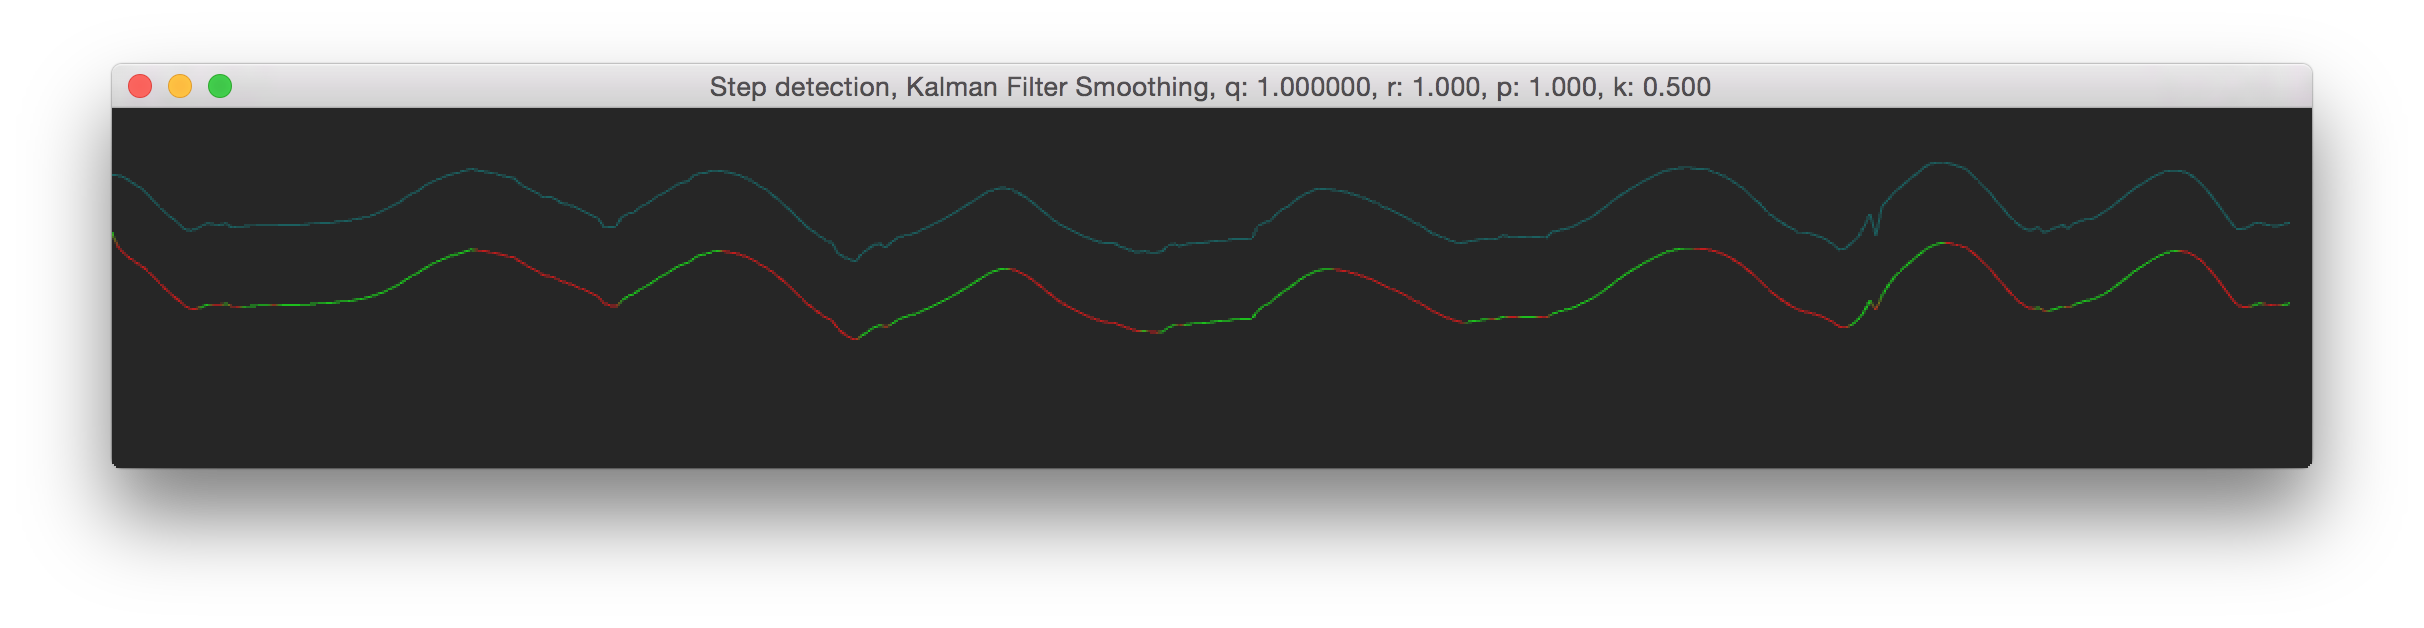
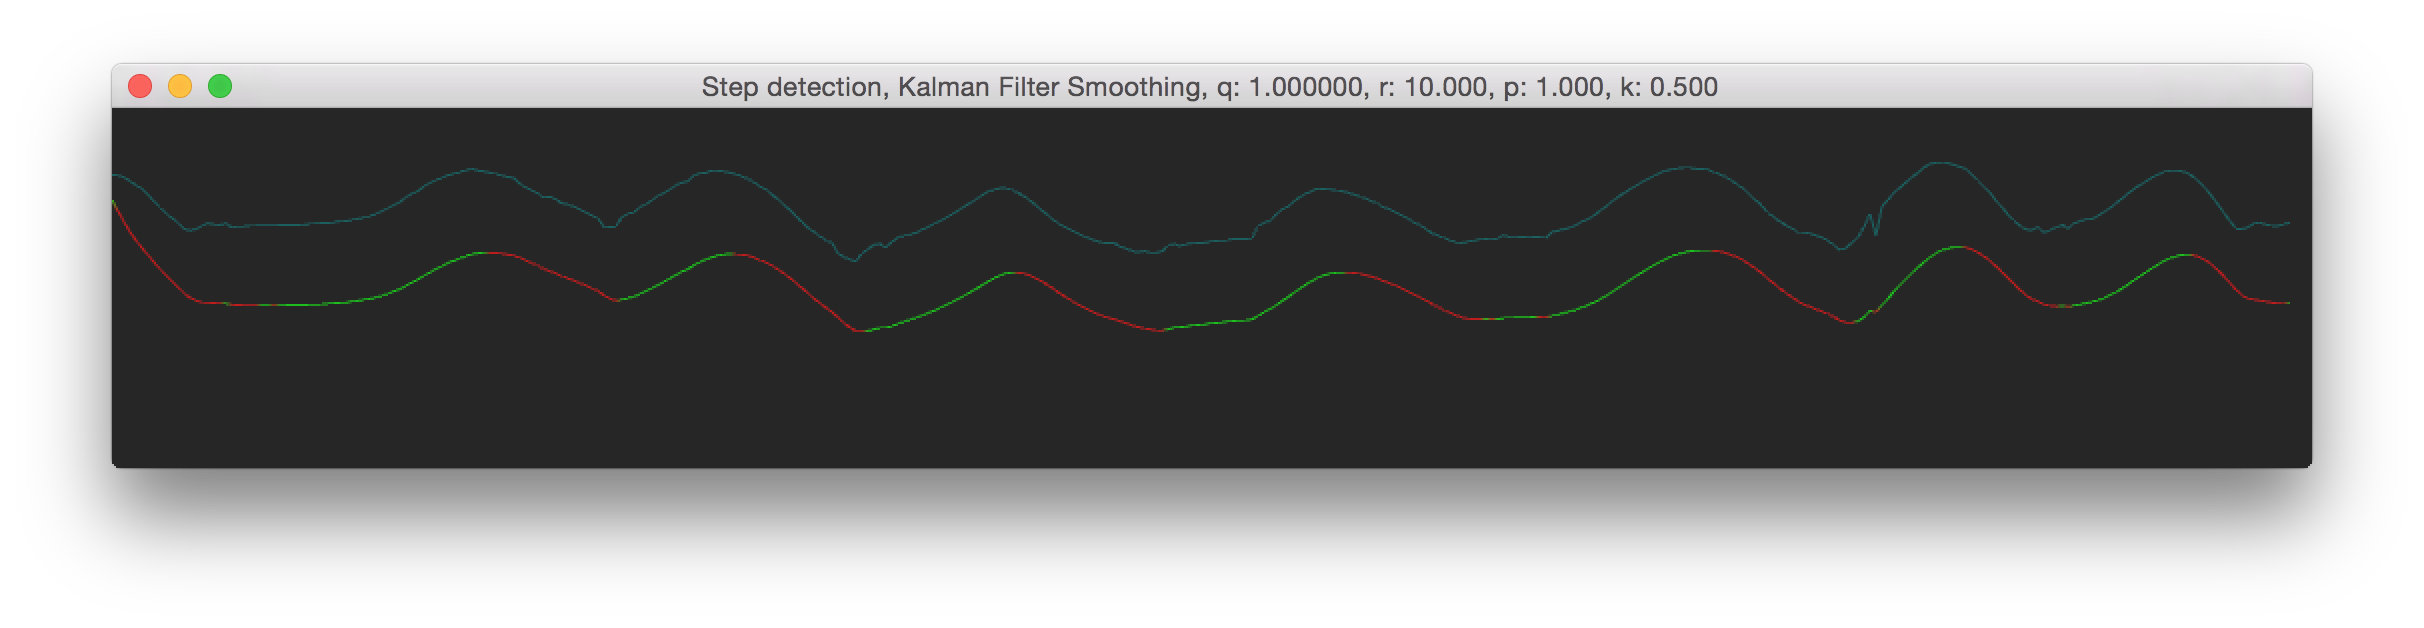
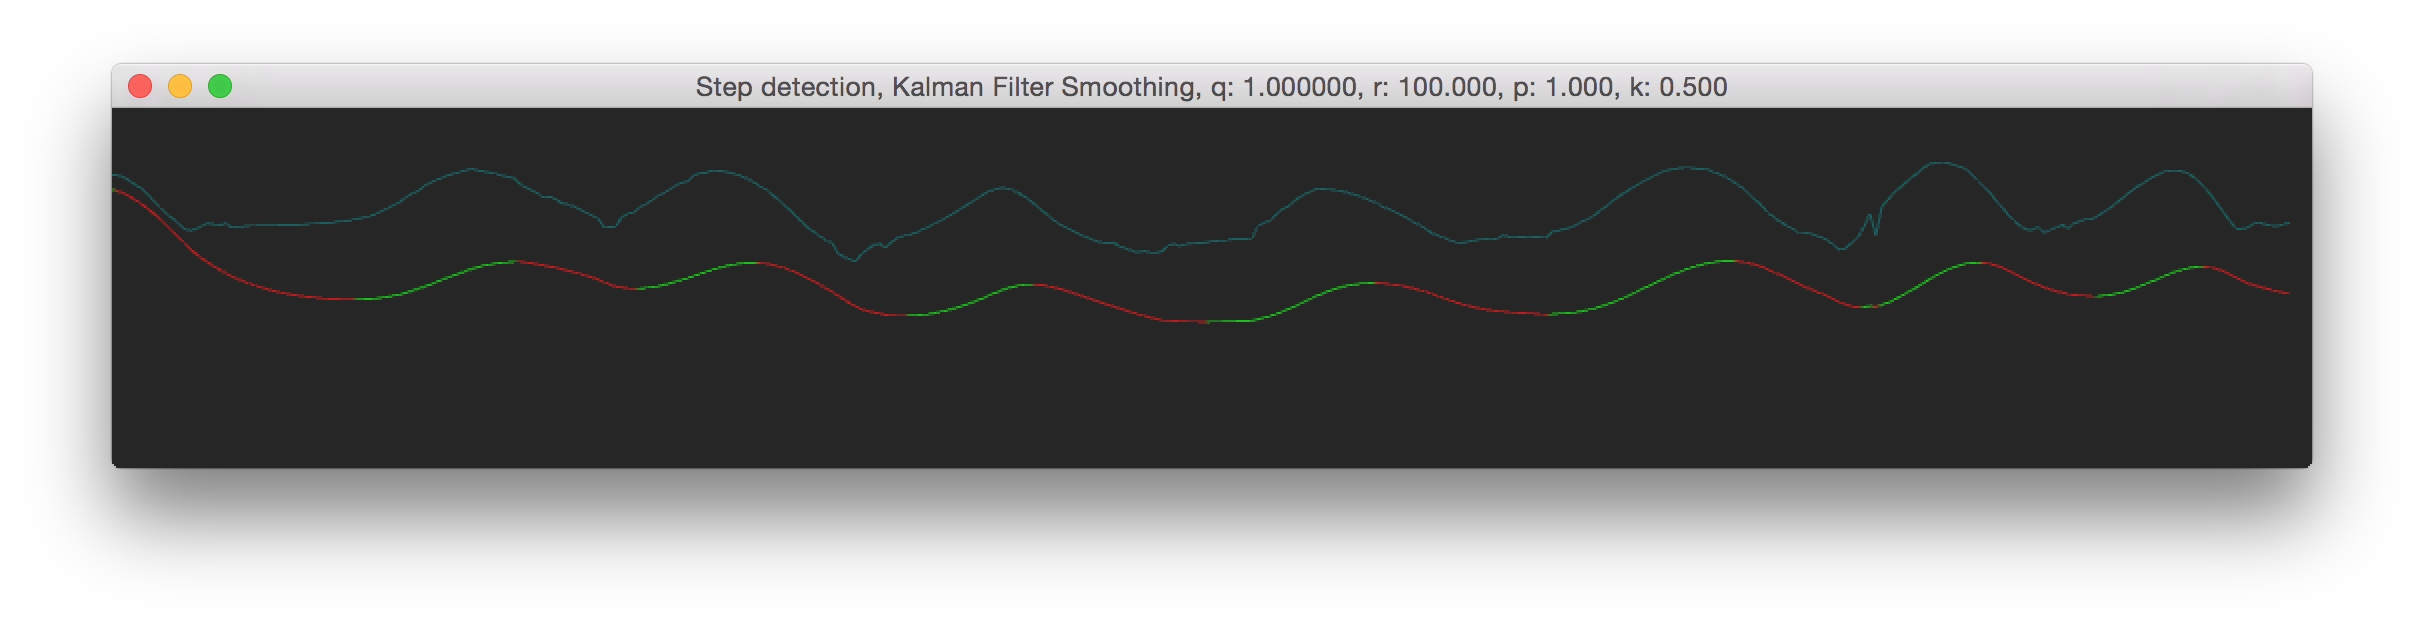
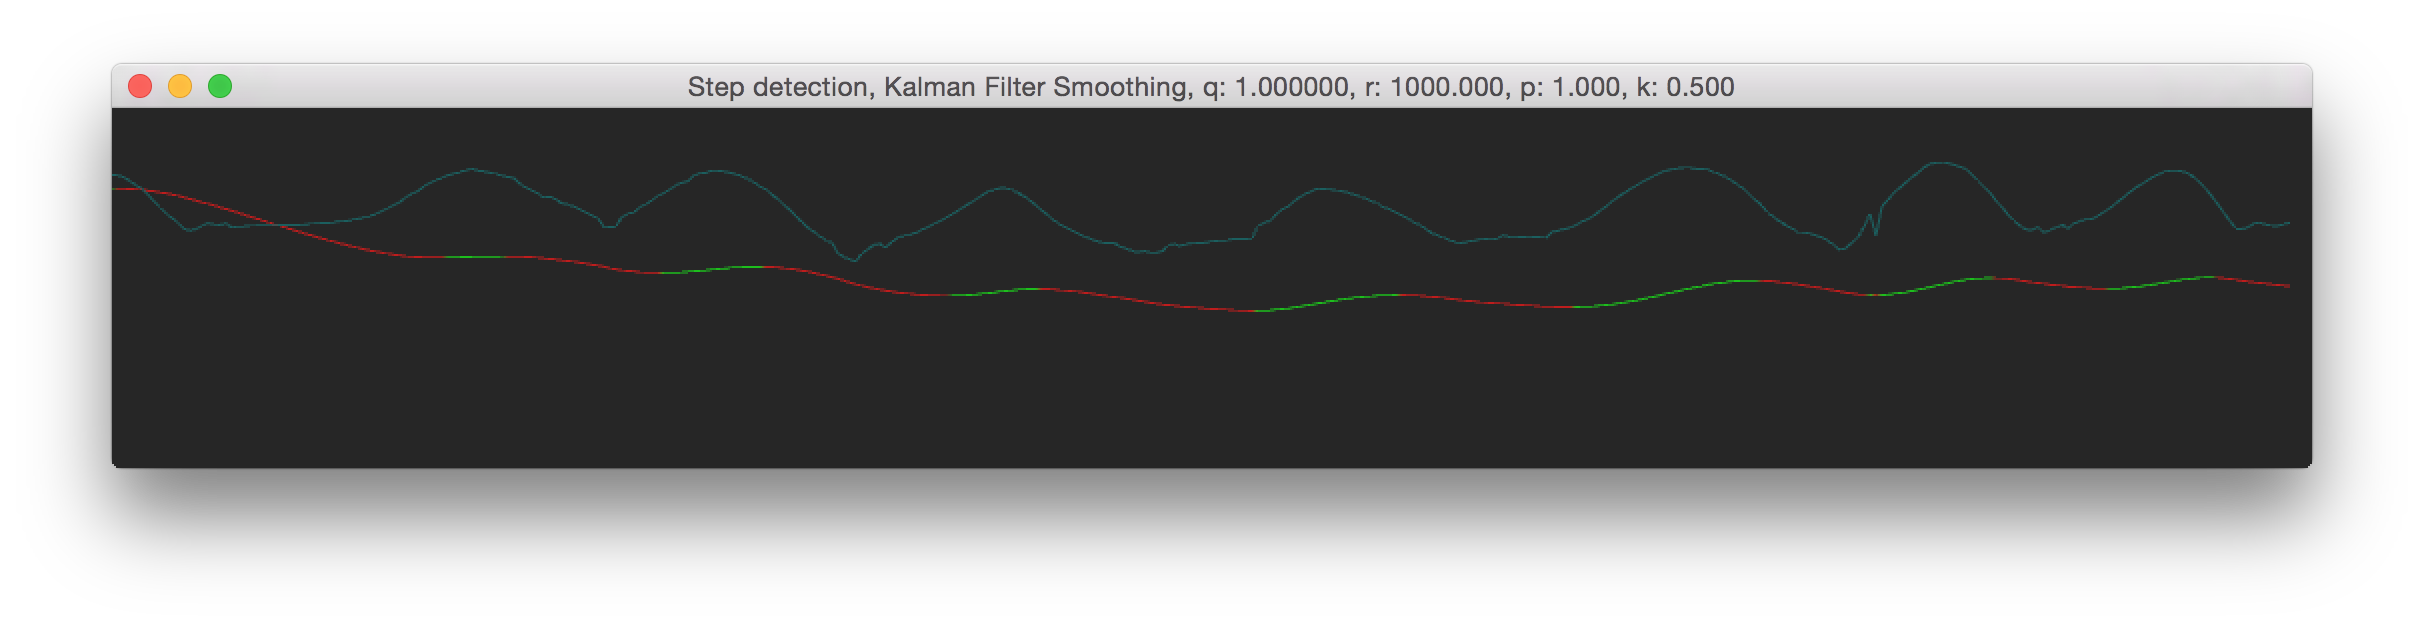
In practical terms, for our height data (which ranges between 0.0 and 0.5) that we were using it meant that we used pretty high values, something like 10-200 to smooth them out. When you use higher values for R, the smoother the output values will become. a good intuition for the R matrix, is that it influences how quickly the output will respond to changes in the input. So lets say you're tracking someones hand but want a smoothly moving position, you would use a high value for R. Below are some differerent R values, see 'r' in the window title The blueish line shows the original data, the red-green line shows the smoothed data.
Q, The Process Noise (constant)
How much noise we expect from the model itself. To mee this is still an pretty vague term; though it doesn't really matter for practical use. In practive you would need to reduce the Q value to get smoother results. We've used a value between 0.025 and 0.00025. Here are some images, see the window title for the Q value.
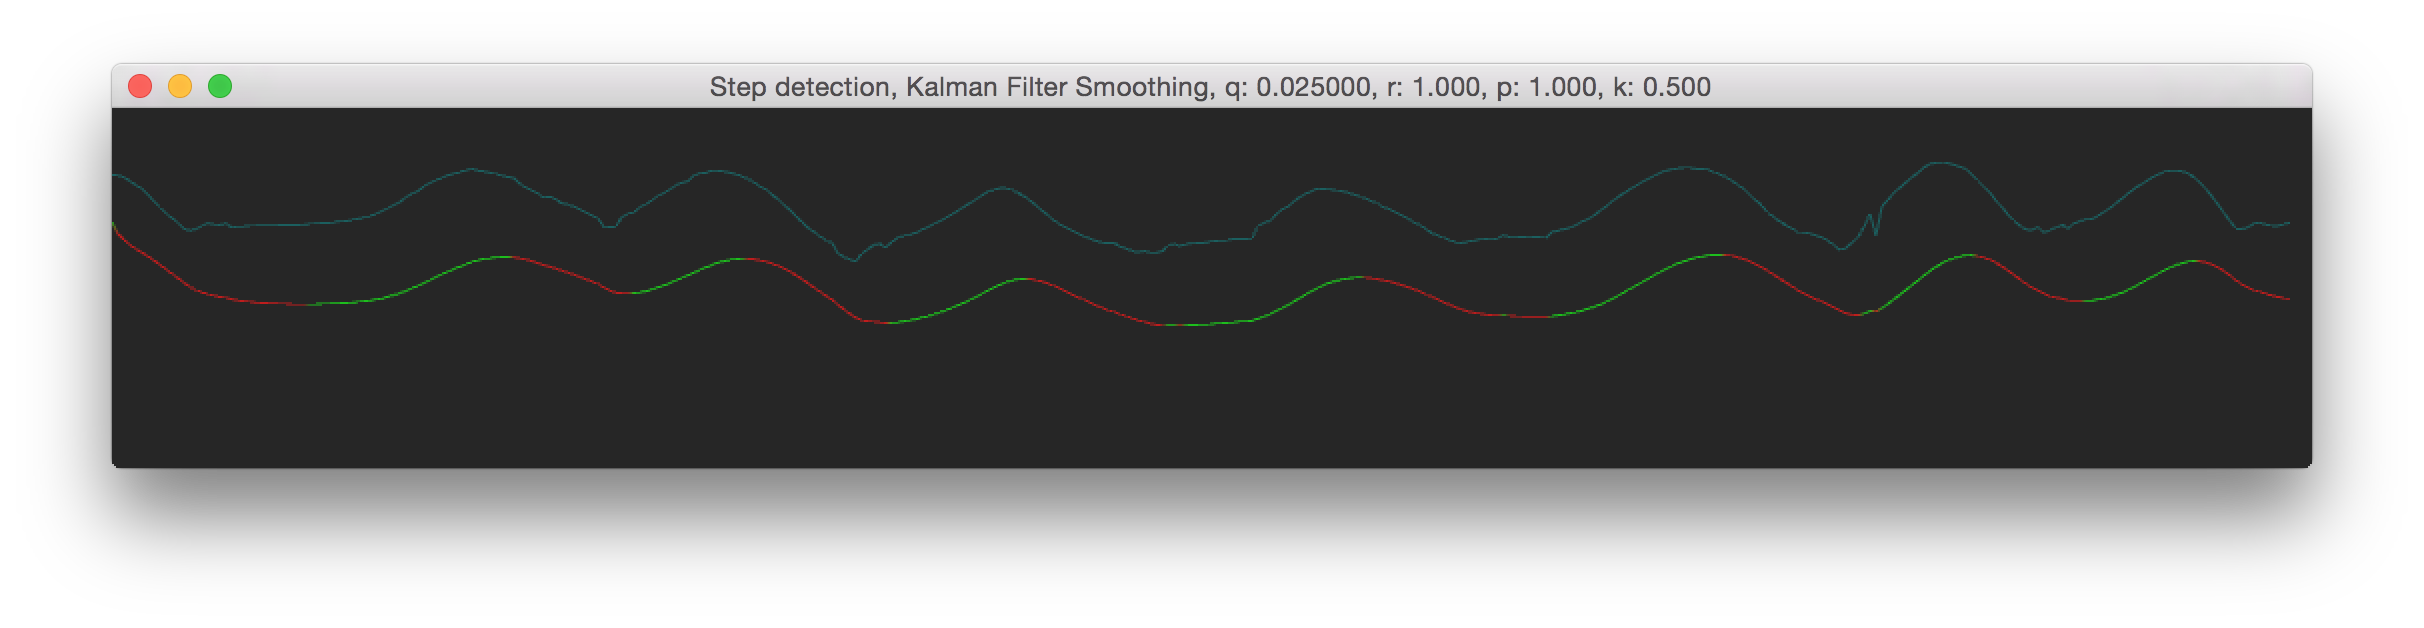
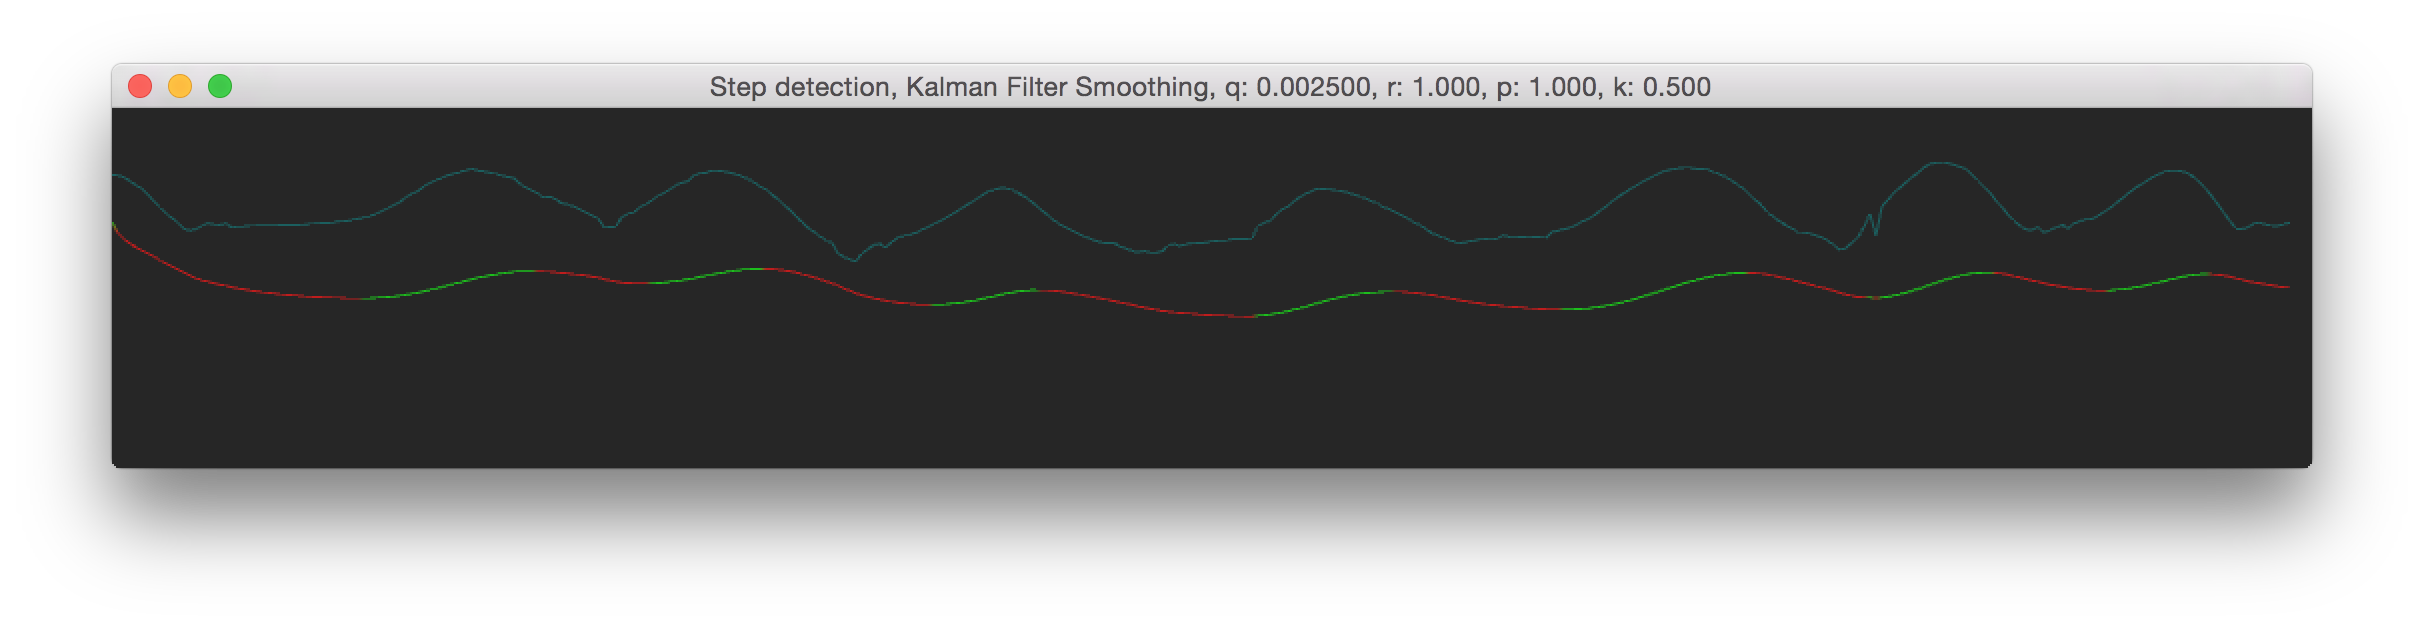
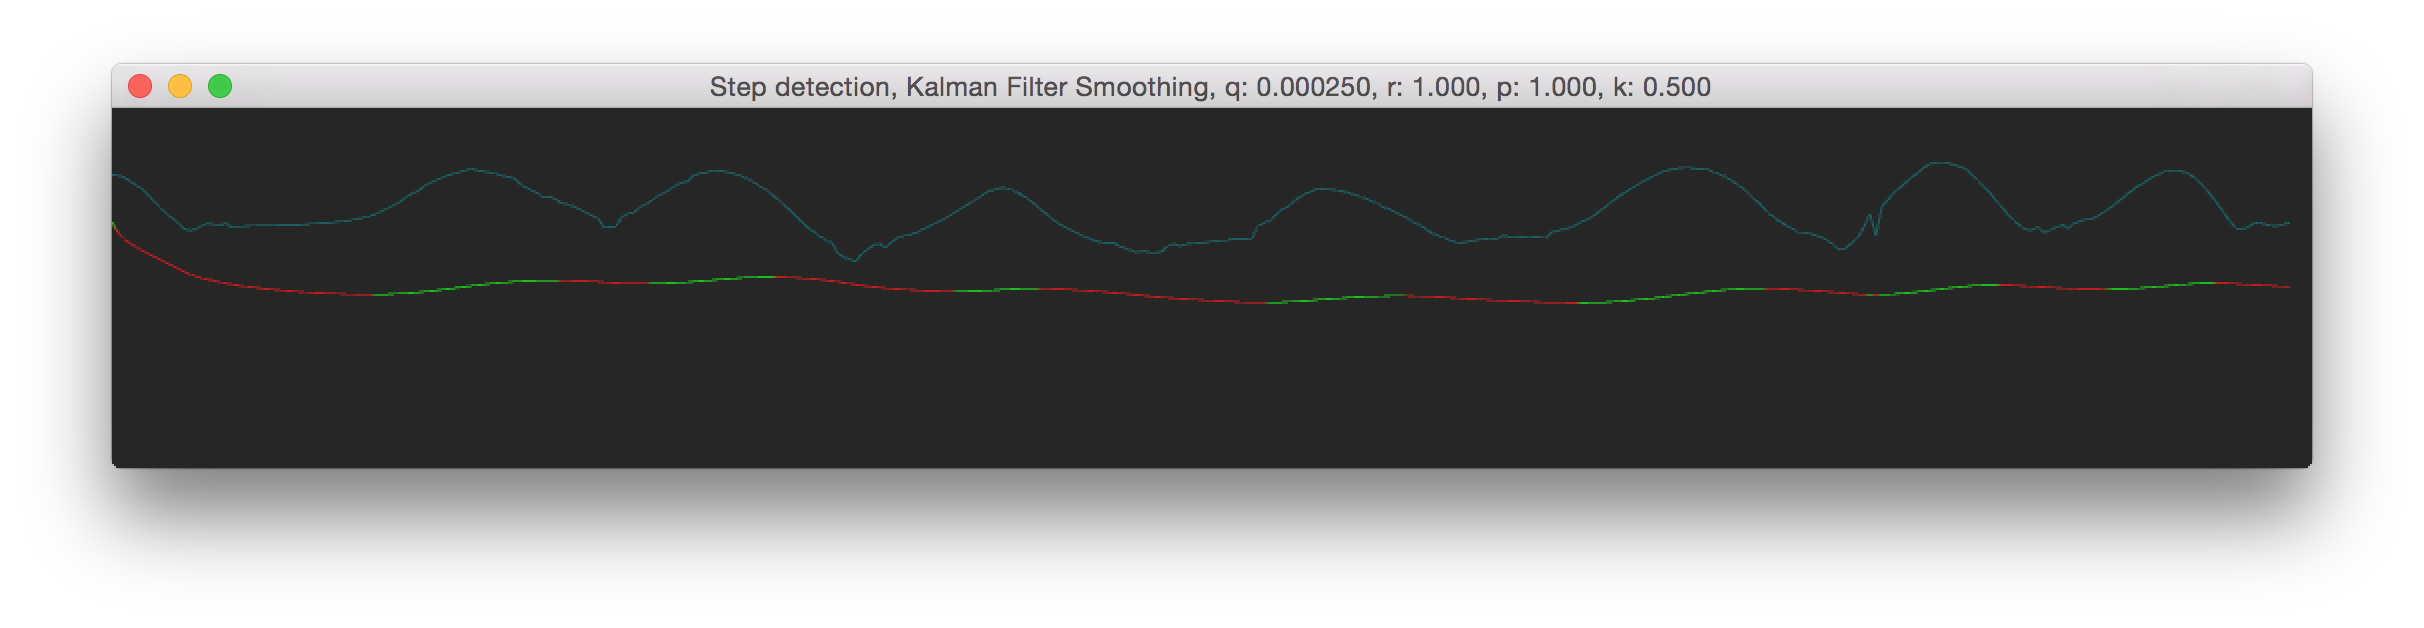
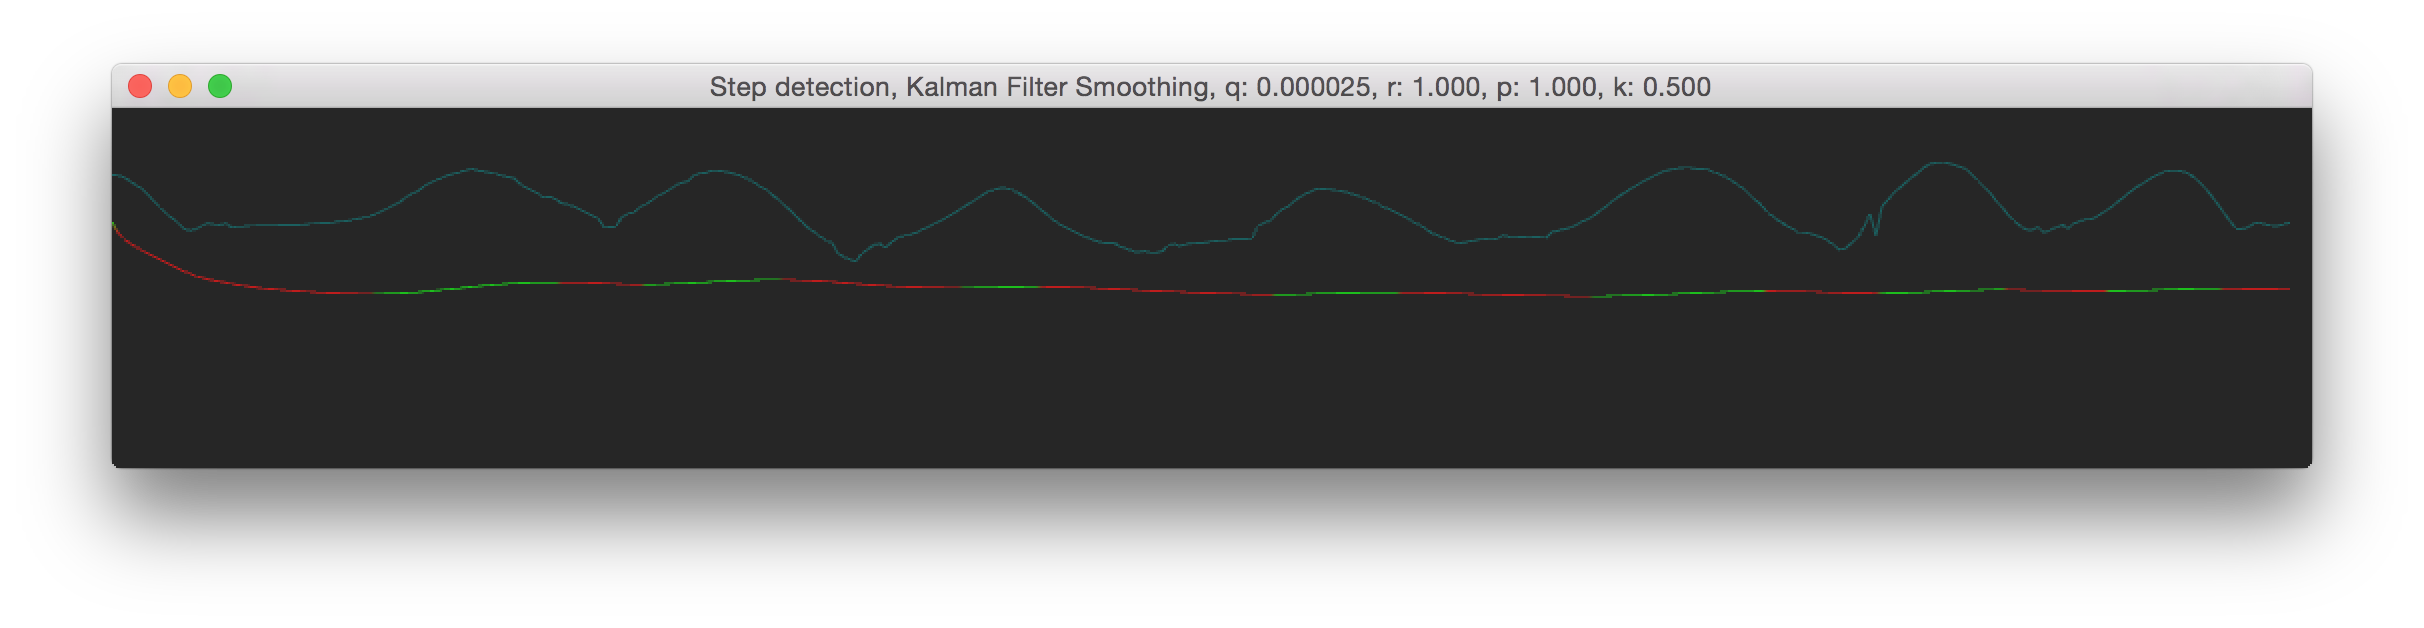
So as you can see from the results above, both Q and R can give you pretty much the same result. There is a lot more to the Kalman Filter then that I've described here, but I hope this gives a somewhat understanding of the Q and R symbols and their meaning. If you find something which isn't correct please contact me at info{at]roxlu[dot]com.
My implementation based on this one.
/*

  Kalman Filter
  =============

  This code implements a kalman filter, based on [1]. This was created to smooth data for a
  step detector and motion tracking system. We want to filter the incoming data before we
  predict positions when we have gaps in the incoming motion capture data. Because we can
  omit some parts of the Kalman Filter, the implementation is a lot simpler than most
  other implementations. See [0] on which this code is based.

  Symbols and parameters
  -----------------------
  Q:  Process Noise (Constant)
      How much noise do we expect from external sources, e.g. wind.

      + Q:  Higher the Q values results in noisier results; the output follows more the measurement values.
      - Q:  Lowering the Q value results in smoother results.
            The filter uses less values from the input.

  R:  Measurement Noise Covariance (Constant)
      How much noise do we expect in our measured data.
      When we turn down this value, the Kalman filter relies more on the sensor data that
      we feed because it thinks that there is not so much noise in the measured data. When
      you turn up this value, the filter will think the input data is noisy and therefore
      the contribution of the measurement value will be a bit less.

      + R:  Higher R values results in smoother lines.
      - R:  Lower R values result in noisier lines.

      From [1]:

          R is also a covariance matrix, but it's the variances and
          covariances of our sensor measurements. Because z has dimension
          m, R is an m by m matrix. The Kalman filter algorithm does not
          change R, because the process can't change our belief about the
          accuracy of our sensors--that's a property of the sensors
          themselves. We know the variance of our sensor either by testing
          it, or by reading the documentation that came with it, or
          something like that. Note that the covariances here are the
          covariances of the measurement error. A positive number means
          that if the first sensor is erroneously low, the second tends to
          be erroneously low, or if the first reads high, the second tends
          to read high; it doesn't mean that if the first sensor reports a
          high number the second will also report a high number.

  References:
  -----------
  [0] http://interactive-matter.eu/blog/2009/12/18/filtering-sensor-data-with-a-kalman-filter/
  [1] https://www.udacity.com/wiki/cs373/kalman-filter-matrices

 */
#ifndef KALMAN_H
#define KALMAN_H

#include <deque>

class Kalman {
 public:
  void init(float q, float r, float p, float x);
  void compute(float z);

 public:      /* Note that covariance means somewthings like how two values change together; e.g. when one changes how much does the other change. */
  float m_q;  /* Process Noise (constant): Covariance: e.g. wind that may influence the measurement. */
  float m_r;  /* Measurement Noise Covariance (constant):  e.g. how noisy are your sensors. measured. */
  float m_x;  /* The measured value. */
  float m_p;  /* Estimation Error Covariance. */
  float m_k;  /* Kalman Gain: how much error correct to apply. */
};

/* ------------------------------------------------------------------------- */

inline void Kalman::init(float q, float r, float p, float x) {

  m_q = q;
  m_r = r;
  m_x = x;
  m_p = p;
}

inline void Kalman::compute(float z) {

  /* Prediction update */
  m_p = m_p + m_q;

  /* Measurement value */
  m_k = m_p / (m_p + m_r);
  m_x = m_x + m_k * (z - m_x);
  m_p = (1.0f - m_k) * m_p;
}

#endif
 NAT Types
 Building Cabinets
 Compiling GStreamer from source on Windows
 Debugging CMake Issues
 Dual Boot Arch Linux and Windows 10
 Mindset Updated Edition, Carol S. Dweck (Book Notes)
 How to setup a self-hosted Unifi NVR with Arch Linux
 Blender 2.8 How to use Transparent Textures
 Compiling FFmpeg with X264 on Windows 10 using MSVC
 Blender 2.8 OpenGL Buffer Exporter
 Blender 2.8 Baking lightmaps
 Blender 2.8 Tips and Tricks
 Setting up a Bluetooth Headset on Arch Linux
 Compiling x264 on Windows with MSVC
 C/C++ Snippets
 Reading Chunks from a Buffer
 Handy Bash Commands
 Building a zero copy parser
 Kalman Filter
 Saving pixel data using libpng
 Compile Apache, PHP and MySQL on Mac 10.10
 Fast Pixel Transfers with Pixel Buffer Objects
 High Resolution Timer function in C/C++
 Rendering text with Pango, Cairo and Freetype
 Fast OpenGL blur shader
 Spherical Environment Mapping with OpenGL
 Using OpenSSL with memory BIOs
 Attributeless Vertex Shader with OpenGL
 Circular Image Selector
 Decoding H264 and YUV420P playback
 Fast Fourier Transform
 OpenGL Rim Shader
 Rendering The Depth Buffer
 Delaunay Triangulation
 RapidXML
 Git Snippets
 Basic Shading With OpenGL
 Open Source Libraries For Creative Coding
 Bouncing particle effect
 OpenGL Instanced Rendering
 Mapping a texture on a disc
 Download HTML page using CURL
 Height Field Simulation on GPU
 OpenCV
 Some notes on OpenGL
 Math
Math
 Gists to remember
 Reverse SSH
 Working Set
 Consumer + Producer model with libuv
 Parsing binary data
 C++ file operation snippets
 Importance of blur with image gradients
 Real-time oil painting with openGL
 x264 encoder
 Generative helix with openGL
 Mini test with vector field
 Protractor gesture recognizer
 Hair simulation
 Some glitch screenshots
 Working on video installation
 Generative meshes
 Converting video/audio using avconv
 Auto start terminal app on mac
 Export blender object to simple file format